We May Get 4 - 6 Weeks of Sideways Gold Trading, Bound by 980 and 1050

Think of life with Ben Bernanke at the money supply helm as driving with a drunk. He mashes the accelerator to the floor and you scream, "Slow down!" He responds by slamming on the brakes. "No, not that!" you cry, so he mashes the accelerator to the floor again.

Last fall he flooded the system with new money (to save his and Paulson's buddies in the banks, but that's another story). Then he slammed on the brakes early this year, so now the money supply's growth is no longer growing. First inflation, then the deflation scare, to which he responds with more inflation. Note closely that he never really deflates, but always inflates, and thus it will ever be. As Steve Saville of speculative-investor.com comments, the Fed exists to manage inflation expectations, not to manage inflation. They are always going to inflate, but to keep everyone from catching on to the game, from time to time they and their media monkeys pump up a deflation scare.

If you understand all this, you grasp where we sit right now. The dollar is rallying, largely because Bernanke is not inflating fast enough. His response will be -- more inflation. But 'twixt now and then, deflation will be the rage. Since SILVER and GOLD PRICES have been rising primarily against the US Dollar, that will slow their rise. However,technically both metals have already fulfilled a 38% correction, sufficient for the preceding rise. If the GOLD PRICE breaks $950, it means not that the bull market is over, but that we will spend numerous months in sideways trading. On the other hand, if the dollar rallies but gold refuses to go below US$975, then we may get 4 - 6 weeks of frustrating sideways trading, bound by 980 and 1,050. Either way, the deadlock will end with gold and silver prices shooting up.

The SILVER PRICE is confirming gold's solidness, remaining above $16.00. Low today was $15.97 (gold's low was $985.42). That's positive, but expect the gold/silver ratio to rise more, which implies mathematically either a lower silver price with gold steady, or higher gold and silver steady.

US DOLLAR INDEX today stands at 77.049, up 13 basis points and continuing its rally. Expect the scrofulous dollar to keep on rising, bit by bit, at least to 78, the 50 DMA.

The rally in STOCKS surely is not long for this world. It has nearly reached the 50% level, has lasted since last spring, and is moving to the deadly seasonal spot. I hope you have taken advantage of this rally by selling your remaining stocks. Or, if you just want to keep on losing money, hold on to them.

Argentum et aurum comparenda sunt -- -- Gold and silver must be bought.

- Franklin Sanders, The Moneychanger
The-MoneyChanger.com

Gold futures back atop $1,000 as greenback weakens

NEW YORK (MarketWatch) -- Gold futures rose above $1,000 an ounce Wednesday, as the dollar declined after the release of upbeat economic data in the U.S., burnishing the appeal of the precious metal.

The U.S. economy shrank in the second quarter at a smaller pace than earlier forecasts, the Commerce Department reported Wednesday. Meanwhile, private-sector employers in September shed the fewest jobs since July 2008.

Gold for December delivery, the most actively traded contract, gained $7, or 0.7%, to $1,001.40 an ounce on the Comex division of the New York Mercantile Exchange. The contract earlier hit an intraday high at $1,006.40.

October gold, the front-month contract, was last up $6.30, or 0.6%, at $999.40 an ounce, after rising as high as $1,003.

Gold prices, as gauged by front-month contracts, are set to end the month up about 5%.

"The softer dollar has supported gold overnight and will continue to provide direction in the coming sessions as risk appetite fluctuates," said James Moore, analyst at TheBullionDesk.com.

"The overall trend of improving economic indicators and inflation concerns look set to push gold higher again and ultimately challenge last year's all-time high," Moore wrote in a note to clients.

The U.S. dollar remained lower on Wednesday after the government said U.S. real gross domestic product for the second quarter was revised to a decline of 0.7% annualized from the earlier estimate of a 1% drop.

The dollar index /quotes/comstock/11j!i:dxy0 (DXY 76.76, -0.36, -0.47%) , which tracks the performance of the greenback against a basket of currencies, fell 0.4% to 76.844 in recent trading.

The U.S. currency and gold typically move in opposite directions. Weakness in the dollar boosts gold prices because it makes the metal cheaper for holders of other currencies.

In other economic data, private-sector firms in the U.S. cut 254,000 jobs in September, according to the ADP employment report released Wednesday.

Economists are expecting a decline of 167,000 in nonfarm payroll jobs when the Bureau of Labor Statistics reports its September estimate on Friday.

Other metals also posted gains Wednesday. December copper futures rose 6.05 cents, or 2.2%, to $2.7895 a pound. Silver for December delivery gained 16.7 cents, or 1%, to $16.34 an ounce.

October platinum gained $10.1, or 0.8%, to $1,281 an ounce and December palladium futures gained $5.15, or 1.8%, to $295.15 an ounce.

Holdings in SPDR Gold Trust /quotes/comstock/13*!gld/quotes/nls/gld (GLD 98.83, +1.40, +1.44%) , the biggest gold exchange-traded fund, stood at 1,094.11 metric tons Tuesday, unchanged for a fourth session

The case for inflation -- and gold

Top investors in precious metals are waiting for a pullback to buy, but they say gold looks like a promising inflation hedge well into the future. China is hungry for it, too.

In a recent trip to New York, I had the opportunity to meet with my (very successful) metal trader friends and some other smart investors, as well as listen to a star-studded cast of brilliant thinkers/investors who shared their world views at the Grant's Interest Rate Observer fall conference.

My metal trader friends all want to see a big flush in gold -- a fairly quick 5% to 8% price drop -- before piling in. But they say if the drop doesn't happen in the next week or so, it probably won't.

I don't want to go into too much detail about what the speakers said at the conference. That would be unfair to those who paid good money to hear their views, and to Jim Grant. But I would like to share a couple of thoughts I came away with and a couple of points made by hedge fund luminary John Paulson, famed for making billions by anticipating the subprime mortgage meltdown.

In the for-what-it's-worth department, when I attended the Grant's conference in the fall of 2007, I noted that there was no outright bearishness and that it seemed folks were pretty sanguine. This was six months after the first payment defaults had begun, which was the start of the vaporization of the subprime industry.

I wrote at the time that I had expected to see much more bearishness at the conference. I didn't know what that meant investment-wise, but I thought it was worth noting.

However, at last week's conference in New York, bearishness was quite profound. That does not mean the participants don't have the right view this time around. And there are certainly many, many good reasons to be bearish. I myself have certainly spilled enough ink listing them.

But other than Grant's view that the size of the collapse means we're about to see a decent-sized bounce in the economy (however sustainable) -- eloquently expressed in his Wall Street Journal article "From bear to bull" -- and, from Paulson, some expression of confidence in investors' animal spirits, there was virtually no optimism.

Gold Fails to Break to New Highs, What's It Waiting For?

GOLD - LONG TERM

Although the week’s gold action seemed to be taking a turn for the worst it still has had no real impact upon the long term trend for gold. The long term P&F chart is still in a strong bullish trend although it has changed direction this past week and still might move lower without long term impact. The price remains above its positive sloping long term moving average line. The long term momentum indicator remains in its positive zone although it has dropped below its now negative sloping trigger line. The long term volume trend remains positive with the volume indicator above its positive sloping trigger line. Despite the weakness starting to show in the momentum indicator, to be expected during a short down price period, the rest of the indicators are still strongly positive giving us a long term rating that is BULLISH.

INTERMEDIATE TERM

We’re starting to see the same weakness coming into the intermediate term momentum indicator but as yet it is not serious. The price remains above its intermediate term positive sloping moving average line. The momentum indicator is heading lower but remains inside its positive zone. It has, however, already moved below its trigger line and the trigger has turned downward. The volume indicator is also starting to show the effects of the recent negative price moves. Although it is still positive it has dropped very slightly below its trigger line. The trigger continues to point in a positive direction. Putting it all together we still have a BULLISH rating for the intermediate term.

SHORT TERM

The short term momentum and aggressive Stochastic Oscillator had been telegraphing a short term reversal of trend over a week ago. It took hold this past week. The price is now below its short term moving average line and the line slope has turned downward. The momentum indicator, although just inside its positive zone. is moving downward and remains below its negative trigger line. The daily volume action has picked up these past couple of days of downside price action. This is usually not good. Putting the short term indicators together I get a rating of BEARISH.

As for the immediate direction of least resistance, the Stochastic Oscillator is plunging downward and is inside its negative zone below its negative trigger line. The price is below a sharply dropping very short term moving average line. There seems to be a support just above the $980 level but that support is not strong. It looks like the price may be heading towards the $925 level so I would think that the direction of least resistance would be to the down side.

SILVER

As I’ve said before “dem that goes up the fastest comes down the hardest”. So it is with silver. It has been out performing gold over the past little while but this week, with the precious metals moving lower, silver dropped far more then gold. Still nothing to worry about. The decline is, so far, of a short term duration. It remains to be seen if it will turn into something more. It could be a decline such as the one in mid-Aug or it could be a little more significant, such as the one in May. Either way, it does not yet look like it will disrupt the long term trend to any serious degree.

It’s interesting to note the actions of the short term momentum indicator (13 Day RSI) and the more aggressive Stochastic Oscillator. In both the gold and silver charts one can see the trend changing by the weakness shown in these indicators. While the price was moving into new high territory the momentum indicators were warning of weakness. Both indicators for both metals refused to make new highs and broke below their Mid-Sept lows almost right at the top of the price move. Now, both of these momentum type indicators are short term indicators. They DO NOT portent to show long term weakness or trends. One would then have to go to the intermediate or longer term indicators for that information. However, these indicators are very often excellent indicators of short term tops and bottoms.

With only some slight differences the gold and silver indicators are very much similar and giving us the same story as far as the ratings are concerned. I’ve gone into the gold analysis above. This basically applies to silver also. Therefore, the long and intermediate term ratings remain BULLISH while the short term rating is now BEARISH.

PRECIOUS METAL STOCKS

I showed the chart of the Merv’s Penny Arcade Index last week. It was once more the best performer of the North American Indices with a loss of only 0.7% versus anywhere from 4% to 7% for most of the other Indices. Have faith, this to me suggests that the bull market is not yet over even though there may be a period of downside pressure. This penny stock Index dropped 87% during its bear market from April 2007 to its bottom in Nov 2008. Now, since its bottom, the pennies have, on the AVERAGE, increased by 560% to Friday’s close. The action looks like there is still much more ahead. Speculators still seem to have a bullish attitude towards gold and silver speculation, and that’s not bearish for the precious metals in general.

As a comparison to the pennies, the PHLX Gold/Silver Sector Index, probably the most followed of the North American “quality” stock Indices, reached its top in May of 2008 and fell only 70% before reaching its low in Oct of 2008. It has since climbed 150% to Friday’s close. Not too shabby for the top quality stocks. They usually do not have the same spectacular performance that the cats and dogs may have, when they move.

As the Table of Precious Metals Indices shows, although the short term is in a down trend the intermediate and long term are still bullish (POS). I would not be surprised to see the intermediate term also go bearish but in the end the long term bull should keep on trucking, at least from today’s view.

MERV’S PRECIOUS METALS INDICES TABLE

Well, that’s it for another week.

By Merv Burak, CMT
Hudson Aero/Systems Inc.
Technical Information Group
for Merv's Precious Metals Central

Peter Schiff: U.S. Rally Is Doomed, Gold May Hit $5000

Silver outshining gold, surges by 22.3%

LONDON (Commodity Online): Silver is singing to gold that old refrain "anything you can do, I can do better". In the three weeks between 27th August-17th September gold's dollar price climbed 8%, impressive by any standard. Yet in the same period the silver price surged from $14.20/oz to $17.38/oz, an astonishing 22.3%.

This knocked the gold/silver ratio down to 58.57, the most it has been in favour of silver since mid-August 2008. Yet a closer look reveals this is less tasty than first appears. When the gold price was last over $1,000/oz - indeed the only other time in history, March 2008 - silver was above $20/oz, nearly 20% higher than its current level.

The explanation is that this time last year silver plunged, when an outright global economic depression appeared a real possibility, and it has yet to fully recover. The dilemma is - will "undervalued" (at least relative to gold) silver play catch-up, or has it rallied too far, too fast? On a day-to-day basis, silver looks to gold for its direction, much more than to copper, or indeed any other commodity. Silver tends to rally harder than gold when both are rallying, and it falls more when both are falling.

That silver is more of an industrial metal than gold is something that seems to affect their relative prices only at pivotal moments, such as when silver collapsed dramatically this time last year. So if gold shifts higher, then silver will continue to outperform.

On the other hand, a gold pullback, which is quite conceivable, should see it underperform. Of course there are some specific differences that might matter. Silver does not have the impact (or, soon to be the lack of impact) of gold hedging/dehedging.

And, unlike gold, there is hardly any official sector activity in silver. So in essence silver supply is more predictable than that of gold, especially given its lower above-ground stocks, and demand is correspondingly more important to its price outlook.

Outlook

If gold goes down, so will silver, and by more. We expect a retreat in silver prices in the short-term, but then further gains in the medium-term as gold resumes its upward path. Whether silver can take out its 2008 high of over $20/oz is debatable, however; at current relative prices it will probably require a gold price in excess of $1,100/oz. Not impossible - but unlikely to be seen in a hurry. Short-term London fix: $14.50/oz-$17.50/oz.

Some Silver News

Sept 17th: Buenaventura, the Peruvian miner, lowered its estimate for silver output in 2009, to 17.5 Moz v. a previous forecast of 19.5 Moz - the same level of output as in 2008.

Aug 8th: Canadian miners Silver Wheaton and Barrick Gold agreed a deal in which Silver Wheaton will take 25% of silver production from Barrick's Pascau-Lama mine and the silver output from three mines Lagunas Norte, Pierina and Veladero until at least 2013 (when Pascau-Lama should be operable). The deal will cost Silver Wheaton $625m over three years plus a maximum of $3.90/oz of silver received.

Gold, silver falter for 3rd day; oil turns higher

NEW YORK — Gold and silver prices fell for a third straight day Friday, even after the dollar reversed early gains and slid lower.

Oil prices rose slightly, while soft commodities were mixed.

Gold for December delivery lost $7.30 to $991.60 an ounce on the New York Mercantile Exchange, finishing the week down 1.9 percent. It was the second day in a row that gold closed below $1,000 after a nine-day streak of closing above that level.

December silver dropped 23.5 cents to $16.06 an ounce — its lowest close in nearly a month.

Commodities began to fall early in the day as the dollar rose, following their usual pattern of trading. But buying still didn't pick up even after the dollar fell back, which would normally spur commodities higher.

The dollar and commodities often trade in opposite directions. Foreign demand for commodities tends to pick up when the dollar weakens since commodities are mainly priced in dollars.

Commodities took a big hit this week as investors moved out of risky assets and back into the dollar for safety amid a sell-off in stocks. Meanwhile, the Federal Reserve issued more assurances this week that inflation is still largely in check. That hurt demand for gold, which is often used as a hedge against inflation.

Among other metals, October platinum fell $23.90 to $1,284.60 an ounce. Palladium also fell. Bucking the trend, December copper futures rose 3.1 cents to $2.7405 a pound.

Oil prices rose for the first time in two days as tensions escalated over Iran's nuclear ambitions. Light, sweet crude for November delivery added 13 cents to finish at $66.02 a barrel. Oil prices faltered earlier this week amid the slumping dollar and government data showing energy demand is still weak.

Gasoline for October delivery lost nearly 2 cents to $1.6205 a gallon, and heating oil for October delivery fell less than a penny to $1.6771 gallon. Natural gas added 3 cents to $3.9850 per 1,000 cubic feet.

Grain prices were mixed on the Chicago Board of Trade.

December wheat futures dropped 23.25 cents to $4.4975 a bushel, while corn for December delivery slipped 2.5 cents to $3.34 a bushel.

November soybeans rose 6.5 cents to $9.26 a bushel.

Among other soft commodities, cocoa and sugar rose, while coffee and cotton fell.

Chartwatch: Gold heads south

Today, Eurodollars rallied. Crude oil entered the second “run” phase of a two-day bear (-) “run…rest…run” pattern. The NASDAQ 100 and S&P 500 attempted a rally that turned into a head-fake, then collapsed, chasing after crude oil. Euro FX and gold were caught in the undertow.

The image below is a screen capture of page 2 of my diary entry for today. The NASDAQ and S&P are in light grey. Bonds are in blue. Eurodollars are in white. Euro FX (EUR/USD) is in green. Gold is in yellow. Crude oil is in dark grey. As long as crude oil remains under pressure, equities, the euro and gold will likley remain under pressure. As always, be careful going forward.

Silver prices to average $13 long-term but could challenge $20/oz in early 2010

A short-term pull back in the price of silver in the next 4 to 8 weeks could well be on the cards after the sharp run-up seen since mid-July but, renewed demand late in the year and in the early parts of 2010, could see the metal challenging the $20/oz level.

This is the view of RBC Capital Markets, which says in its "review of all things silver" it retains its positive view on silver in the short to medium term because of: "Continued fundamental outlook for a weaker U.S. dollar, which we believe in turn will likely result in stronger precious metal prices (both gold and silver)."

Also, the group says, that demand increases for industrial and investment segments are forecast to more than offset continuing decline in photographic demand."

But, while there are also likely to be significant production cut-backs in some base-metals, which is expected to dampen by-product silver output over 2009, the group does caution that in the medium to longer term, it is concerned that "increasing primary silver mine supply" could "eventually cap the upside for silver prices."

On the subject of supply and demand, RBCCM, is fairly bullish given its belief that its view of the silver market and its drivers has been made slightly clearer by "the significant drawdown of above-ground stockpiles over the past 10-15 years to meet the annual excess of global demand over new mine supply"

681 million ounces of silver was produced in 2008, the fifth consecutive year of record-setting results according to RBCCM, and while much of this came as a by product of other metals, a number of new primary silver operations are expected to come on stream in the near future.

And, while the increase is likely to be partially offset by mine closures, the group says, "these new primary and by-product operations could add 75-85MM oz of annual silver production (+10% of global mine supply) by the end of the decade.

Another concern highlighted in the report is Chinese silver production which is currently estimated at about 10% of global mine supply.

While the group says it is a difficult area to monitor as a result of the sheer number of small mines and smelters, it believes China is "a larger player than its domestic production would suggest, as the country is a large importer of metal concentrates (copper, lead-zinc), which are then processed at Chinese smelters and refineries and by-product silver is recovered (for either domestic use, export, or stockpiling)."

Indeed the group believes that China's above-ground stockpile is likely to have increased over the last few years.

It adds that, while "total above-ground stocks may have declined to a few hundred million ounces of silver, our global supply/demand forecasts suggest these levels may be sufficient to meet the demand gap for a number of years. Alternatively, we believe that new demand drivers are required in order to eliminate the remaining overhang from above-ground silver stockpiles."

One of the new key demand drivers is investment directly into the silver market and RBCCM maintains that for 2008, total silver ETF holdings grew by about 100MMoz.

"This year, our outlook is for continued positive demand for the silver ETFs, perhaps slightly higher levels than were seen in 2008. YTD, the iShares Silver Trust has already added 62MMoz, bringing total silver holdings to 280.6MMoz. The other two ETFs have added another 28MMoz, to bring 2009YTD demand to over 90MMoz. As a result, we have increased our forecast for total new ETF demand from 88 to 110MMoz for 2009."

So where does this leave silver prices?

According to the RBCCM report, silver is expected to produce an average price of around $13.25 over the year, before rising to $13.50 in 2010 and settling on a long-term average of around $13 from 2011 onwards.

And, in terms of its relationship to gold, the group says, "The ratio of the gold price to the silver price saw a dramatic move in favor of gold in Q4/08, reaching a peak of almost 85:1. Historical 1-, 5- and 10-year averages were significantly lower (closer to 60:1), suggesting to us back in January the potential for a reversion to the mean opportunity, which we believe could favor silver. This mean reversal has transpired, with the gold/silver ratio retracted to 59:1, and therefore we think this opportunity has played out.

"Given our view of weaker fundamentals for silver (compared to gold), we forecast the gold/silver ratio as more likely to settle out around 70:1, rather than 50:1 (our long-term $13/oz forecast assumes a 73:1 gold/silver ratio).

Gold dips after weak housing data

NEW YORK (MarketWatch) -- Gold futures were lower on Thursday, as the dollar firmed after the National Association of Realtors said existing home sales fell 2.7% to 5.10 million in August, the first monthly drop in five months. Gold for December delivery was down $6, or 0.6%, at $1,008.50 an ounce on the New York Mercantile Exchange. The dollar index /quotes/comstock/11j!i:dxy0 (DXY 76.63, +0.58, +0.76%) , which measures the U.S. unit against a basket of six major currencies, stood at 76.558, up from 76.377 in late New York trade Wednesday. The decline in sales was unexpected by most economists. The median forecast by economists surveyed by MarketWatch was for a small gain to a 5.40 million annual rate from 5.25 million in July

Gains, falls for gold probably mean bigger ones for silver – VM Group

ORONTO (miningweekly.com) – Whether the gold price eases or moves higher, silver will likely do the same, but to a greater degree, analysts at VM Group said in a report on Wednesday.

“Silver is singing to gold that old refrain: 'anything you can do, I can do better,” VM comments in the September issue of its BNP Paribas Fortis/VM Group Metals Monthly report.

“So if gold shifts higher, then silver will continue to outperform.”

However, if gold goes down, “so will silver, and by more”.

VM expects a retreat in silver prices in the short term, but then further gains in the medium term, as gold resumes its upward path.

“Whether silver can take out its 2008 high of over $20/oz is debatable, however; at current relative prices it will probably require a gold price in excess of $1 100/oz,” the VM analysts said.

“Not impossible, but unlikely to be seen in a hurry.“

In the three weeks to September 17, gold's dollar price climbed 8%, while silver rose an “astonishing” 22,3%, to $17,38/oz over the same period.

This reduced the gold/silver ratio down to 58,57, the most it has been in favour of silver since mid-August 2008.

However, compared with the March 2008, when gold last rose above $1 000/oz, silver is still relatively undervalued – it was above $20/oz at that time.

“The explanation is that this time last year silver plunged, when an outright global economic depression appeared a real possibility, and it has yet to fully recover,” VM said.

In a report on Wednesday, RBC analysts Michael Curran and Cailey Barker also predict that gold and silver prices will pull back over the next month or two, followed by renewed strength later in the year.

The believe silver will likely retreat to the $14/oz to $15/oz range, but could reclaim the $20/oz level in the next round of strength, if gold tests the $1 050 level.

RBC maintained a silver price forecast of $13,25/oz for 2009 and $13,50/oz for 2010.

“While our 2009 forecast looks a little light, as year-to-date spot silver has averaged $13,60/oz, we are waiting to see if our forecast of a pullback in the next month or so proves accurate,” the analysts said.

Edited by: Liezel Hill

US gold falls on dollar rise, weak oil ahead of Fed

NEW YORK, Sept 23 (Reuters) - U.S. gold futures dropped on
Wednesday on a dollar bounce and weaker oil, but traders said
bullion would largely be range-bound ahead of closely watched
policy-setting announcements by the Federal Reserve.
 For the latest detailed report, click on [GOL/].
 GOLD
 * December gold GCZ9 down $7 at $1,008.50 an ounce at
10:43 a.m. EDT (1443 GMT) on the COMEX division of New York
Mercantile Exchange.
 * Ranged from $1,007.20 to $1,020.40.
 * The combination of a stronger dollar and sharply lower
crude oil prices triggered profit-taking in gold futures -
traders.
 * U.S. oil futures dropped nearly $3 to under $70 a barrel
after weekly government data showed a rise in crude inventory.
[O/R]
 * Precious metals are expected to trade range-bound ahead
of the Federal Reserve announcement this afternoon, but any
rate hike will put pressure on precious metals - Miguel
Perez-Santalla, vice president of sales of Heraeus Precious
Metals Management.
 * The world's largest gold-backed exchange-traded fund
(ETF), the SPDR Gold Trust GLD, said its holdings were
unchanged at 1,101.735 tonnes as of Sept. 22, but it was up
from 1,086.479 tonnes on Sept. 18.
 * The increase in ETF demand in the face of high prices is
supportive of the gold rally - James Steel, chief commodities
analyst at HSBC.
 * Gold-to-oil ratio at 14.55, up from the previous
session's 14.21.
 * COMEX estimated 10 a.m. volume at 43,460 lots.
 * Spot gold XAU= at $1,006.60 versus $1,013.80, which was
the previous session's late New York quote.
 * London afternoon gold fix XAUFIX= was at $1,010.25 an
ounce.
 SILVER
 * December silver SIZ9 down 33.5 cents, or 1.9 percent,
at $16.780 an ounce, tracking gold's decline.
 * Range from $16.720 to $17.290.
 * COMEX estimated 10 a.m. volume at 11,721 lots.
 * Spot silver XAG= was at $16.74 versus its previous
finish of 17.10 an ounce.
 * London silver fix XAGFIX= at $17.10 an ounce.
 PLATINUM
 * October platinum PLV9 down $13.70, or 1 percent, at
$1,325.50 an ounce, following general weakness of metals across
the board.
 * Spot platinum XPT= was at $1,319.50 compared with its
previous finish of $1,332.
 PALLADIUM
 * December palladium PAZ9 down $5.20, or 1.7 percent, at
$297.20 an ounce, down with platinum.
 * Spot palladium XPD= was at $295 against its previous
close of $300.
Prices at 10:45 a.m. EDT (1445 GMT)
                       Last  Change   Pct      2008   YTD
                                      Chg    Close  % Chg
US gold GCZ9 1008.60 -6.90 -0.7 884.30 14.1
US silver SIZ9 16.805 -0.310 -1.8 11.295 48.8
US platinum PLV9 1327.00 -12.20 -0.9 941.50 40.9
US palladium PAZ9 299.50 -2.90 -1.0 188.70 58.7
Gold XAU= 1006.90 -6.90 -0.7 878.20 14.7
Silver XAG= 16.76 -0.34 -2.0 11.30 48.3
Platinum XPT= 1320.00 -12.00 -0.9 924.50 42.8
Palladium XPD= 294.50 -5.50 -1.8 184.50 59.6
Gold Fix XAUFIX= 1010.25 -4.50 -0.4 836.50 20.8
Silver Fix XAGFIX= 17.10 -14.00 -0.8 14.76 15.9
Platinum Fix XPTFIX= 1325.00 8.00 0.6 1529.00 -13.3
Palladium Fix XPDFIX= 299.00 2.00 0.7 365.00 -18.1
(Reporting by Frank Tang; Editing by Lisa Shumaker)


Gold and Silver into the Next Decade

The critical juncture we suggested for silver last week has not changed. All the factors we have looked at point to silver dropping in the medium term though the shorter term (days to weeks) has scope for volatility. The RMA parameter mentioned before has sounded an alarm but for now a low decibel one. Other factors though are more shrill (refer to my blog for more details).

What I would like to point out (again) is that any correction is not the end of the matter for the gold and silver bull. The gold “M2 supply” chart we displayed some weeks back paints the picture of a bull market that is not over yet. This is an important chart that I think needs to be properly digested (gold cycles in black, silver price in red).

(Click on image to enlarge)

The strong implication of this chart is that gold and silver have a few years left to run higher. In this remaining time frame I expect gold to challenge the 1980s highs on an inflation adjusted basis. Gold made new nominal highs at $1032 in March 2008 but that is well short of the inflation adjusted 1980 high of about $2500. Silver is unlikely to challenge its inflation adjusted high of $135 unless a mega-buyer like the Hunt brothers steps in again but the nominal high of $52 is certainly an objective.

The timeframe for this blow off is 2012 at the earliest which brings me to another issue. In terms of Elliott Wave Analysis, I used to think that gold and silver would both trace out a five part impulse wave from the beginning (1999 or 2001 for gold) and we would witness a classic fifth wave climax in the distant future.

I don’t think that will happen now - the projected 2012 timeframe does not allow enough time for it. If wave 1 was 1999/2001 to 2008 and this is a current wave 2 correction then two of the five waves have already occupied at least 8 years of a possible 13+ year bull market. That does not leave much time for waves 3, 4 and 5. So my opinion is that the entire bull market will be a three wave affair of which the second wave is nearing completion. Another confirmation for that is that the 1964-1980 bull was a distinct three wave pattern. The final third wave will outdo the first bullish wave and if we take the first gold bull wave to be from $255 to $1032 and multiply it by a likely Fibonacci 1.618 extension then the final blow off third wave for gold could reach out to about $2000 (i.e. $700 + ($1032-$255)*1.618) but it could of course go higher.

Applying the same projections to silver brings us to a minimum projection of $35 but it could spike briefly higher (i.e. $8.50 + ($21.34 - $4.50)*1.618)). By some coincidence, we also note that $35 is also simply $21 multiplied by 1.618. I would also point out that a projected line from the 2004, 2006 and 2008 silver highs extends out to the low $30s as a possible confirmation. Silver and gold stocks will naturally leverage higher by a factor of 2:1 or more.

That all sounds exciting for the precious metals investor but for the meantime investors need to be prepared for a medium term wash out in preparation for the next and final great buying opportunity.

Further analysis of silver can be had by going to our silver blog at http://silveranalyst.blogspot.com where readers can obtain a free issue of The Silver Analyst and learn about subscription details. Comments and questions are also invited via email to silveranalysis@yahoo.co.uk.

Roland Watson

US gold ends up, nears $1,020/oz on dollar tumble

NEW YORK, Sept 22 (Reuters) - U.S. gold futures rose toward
$1,020 an ounce on Tuesday, gaining 1 percent as a sharp
deterioration of the dollar's value triggered investment buying
in gold as a currency hedge.
 For the latest detailed report, click on [GOL/].
 GOLD
 * December gold GCZ9 settled up $10.60, or 1.1 percent,
at $1,015.50 an ounce on the COMEX division of New York
Mercantile Exchange.
 * Ranged from $1,004.20 to $1,021.50.
 * Gold boosted by a tumbling dollar. Deteriorating
sentiment toward the U.S. currency pushed FX dealers to sell it
ahead of a Federal Reserve meeting and Group of 20 summit this
week. U.S. dollar index .DXY fell almost 1 percent against a
basket of major currencies. [USD/]
 * Gold's rally primarily was driven by its inverse
relationship with the U.S. dollar - Frank Holmes, chief
executive officer and chief investment officer of U.S. Global
Investors, a commodities-focused fund manager.
 * Gold could still go higher in deflationary economy
because of currency devaluation as a result of deficit spending
and a strong resolve to keep interest rates negative - Holmes.
 * Gold, which is priced in the U.S. currency, usually goes
up with a falling greenback. Gold is also seen as an
alternative to holding dollar-denominated assets and other
major currencies.
 * Gold's status as an investment continues to rise. The
world's largest gold-backed exchange-traded fund, the SPDR Gold
Trust GLD, said its holdings stood at 1,101.735 tonnes as of
Sept. 21, up from 1,086.479 tonnes the previous day.
 * Lack of gold jewelry demand, however, could limit further
gains - traders.
 * India's gold imports in 2009 may fall to their lowest
level since trade was liberalized 12 years ago as high prices
have put off buyers in the world's biggest market for the metal
- top Indian importer. [ID:nBOM512227]
 * Worries about imminent shorter-term traders also dragged
prices lower, as trade data showed that speculators held a
record net long position in U.S. gold futures.
 * U.S. crude futures rebounded above $71 per barrel on
improved sentiment for demand and a weaker dollar. [O/R]
 * Gold-to-oil ratio at 14.21, down from the previous
session's 14.41.
 * COMEX estimated final volume at 96,316 lots.
 * Spot gold XAU= at $1,013.25 at 2:32 p.m. EDT (1832 GMT)
versus $1,002.55, which was the previous session's late New
York quote.
 * London afternoon gold fix XAUFIX= was at $1,014 an
ounce.
 SILVER
 * December silver SIZ9 finished up 23.5 cents, or 1.4
percent, at $17.115 an ounce, up with gold.
 * Range from $16.830 to $17.345.
 * COMEX estimated final volume at 21,997 lots.
 * Spot silver XAG= was at $17.07 versus its previous
finish of 16.80 an ounce.
 * London silver fix XAGFIX= at $17.24 an ounce.
 PLATINUM
 * October platinum PLV9 ended up $17, or 1.3 percent, at
$1,339.20 an ounce on the back of stronger global equities
markets.
 * Spot platinum XPT= was at $1,329 compared with its
previous finish of $1,315.50.
 PALLADIUM
 * December palladium PAZ9 closed up $3.25, or 1.1
percent, at $302.40 an ounce.
 * Spot palladium XPD= was at $300 against its previous
close of $294.50.
                     Close  Change   Pct     2008    YTD
                                     Chg   Close   % Chg
US gold GCZ9 1015.50 10.6 1.1 884.3 14.8
US silver SIZ9 17.115 0.235 1.4 11.295 51.5
US platinum PLV9 1339.20 17.00 1.3 941.50 42.2
US palladium PAZ9 302.40 3.25 1.1 188.70 60.3
Prices at 2:32 p.m. EDT (1832 GMT)
Gold XAU= 1013.35 10.80 1.1 878.20 15.4
Silver XAG= 17.07 0.27 1.6 11.30 51.1
Platinum XPT= 1329.00 13.50 1.0 924.50 43.8
Palladium XPD= 300.00 5.500 1.9 184.50 62.6
Gold Fix XAUFIX= 1014.00 -1.75 -0.2 836.50 21.2
Silver Fix XAGFIX= 17.24 56.00 3.4 14.76 16.8
Platinum Fix XPTFIX= 1330.00 3.00 0.2 1529 -13.0
Palladium FixXPDFIX= 302.00 4.00 1.3 365.0 -17.3
(Reporting by Frank Tang; Editing by Lisa Shumaker)


Gold, Silver Prices Jump

Gold and silver futures are sharply higher early Tuesday in response to another bout of weakness in the U.S. dollar, analysts said.

Around 8:48 a.m. Eastern, December gold was up $14.20 to $1,019.10 an ounce on the Comex division of the New York Mercantile Exchange. December silver was up 42.5 cents to $17.305.

[Gold] Bloomberg News

"It's the dollar failing more than anything else," said Charles Nedoss, senior account manager and metals analyst with Peak Trading Group.

He pointed out that the December dollar index has fallen below the low hit last week, bottoming so far at 76.22. The euro has hit a one-year high of $1.4825, up from $1.4676 late Monday in New York.

"This pretty much negates any bottoming activity that we thought we were seeing, at least near term," said Sterling Smith, commodity trading adviser and market analyst with Country Hedging. "That has gold excited and is pushing a general run in commodities this morning."

The market will be watching to see if anything emerges from a Group of 20 meeting later in the week to prop up the dollar, Mr. Smith said.

Meanwhile, October platinum rose $14.80 to $1,337 an ounce, while December palladium gained $5.80 to $304.95 an ounce.

Junior explorer soars on gold/silver results

Precious metals assays seemed to whet the appetites of some speculators Monday, while diamonds were a shareholder’s best friend.

Stockhouse Canadian Small and Micro-cap Stock Report for Monday, September 21, 2009

TORONTO (SHfn) – Precious metals assays seemed to whet the appetites of some speculators Monday, while diamonds were a shareholder’s best friend.

Richfield Ventures (TSX: V.RVC, Stock Forum) shares climbed 57% to $1.18 on Monday after the micro cap explorer announced assay results for three further diamond drill holes of its 15 hole fall program on the Blackwater project in British Columbia, which included 207 metres of 1.06 grams per tonne (g/t) gold and five g/t silver.

As well, shares of Peregrine Diamonds (TSX: T.PGD, Stock Forum) shot up 108% to $1.85 as the junior miner reported the discovery of large diamonds and a coarse diamond size distribution in representative drill core samples collected from the CH-6 kimberlite located on the 9,800 square kilometre Chidliak project on Baffin Island, Nunavut. A 398.8 kilogram sample collected from CH-6 yielded 2,730 diamonds larger than the 0.075 mm sieve size, including 131 diamonds larger than the 0.600 mm sieve size. The largest diamond recovered from the sample was a 0.62 carat white, transparent aggregate.

Running Fox Resource (TSX: V.RUN, Stock Forum), meanwhile, said it has entered into an exclusive arrangement that would enable it, following successful asset review, to acquire an operating Canadian diamond drilling company. The private company is technically advanced and operates one to three drill systems depending on the size of a drilling contract, with current capabilities down to 6,000 feet, including in very rough terrain. Running Fox stock popped 58% to 28.5 cents.

Shares of Æterna Zentaris (TSX: T.AEZ, Stock Forum) jumped 11% to $1.45 after the biopharmaceutical firm focused on endocrine therapy and oncology announced the completion of a Phase 1 study of its orally-active tubulin and topoisomerase II inhibitor compound, AEZS-112, in patients with advanced solid tumors or lymphoma.

Sparton Resources (TSX: V.SRI, Stock Forum) shares surged 50% to 15 cents after the junior explorer/developer reported that effective September 9, 2009, its wholly-owned China subsidiary company Yunnan Blue Bay Mining Co. has completed the acquisition of a 51% share interest in 306 Huajun Coal Co. Ltd., the company producing germanium concentrates and thermal coal in the Lincang area of Yunnan Province, China. Recent analyses indicate that Huajun concentrates contain up to 0.17% tungsten (potentially commercial amounts) and 0.012% yttrium.

And, Mexivada Mining (TSX: V.MNV, Stock Forum) Monday said it has discovered a diatreme volcanic pipe intrusive body located near (39 g/t) gold-quartz float mineralization sampled at the surface on its wholly-owned Goldstorm property in Nevada. Dioritic rocks in this young diatreme pipe body look similar to rocks at the Goldstrike mine of Barrick. Its shares powered 110% higher to 21 cents.

Perfect storm for gold and silver

As gold trades above US$1,000 (HK$7,800) an ounce once again, it has been attracting renewed investor interest.

Many are wondering whether it is too late to enter the fray, or if it's still a good time to gain exposure.

In our view the latter is the case, since the perfect storm of bullish factors for precious metals is just only starting to come together.

It should be reiterated that there appears to be no end in sight for the "quantitative easing" (money-printing) policies of the United States and Europe. (Quantitative easing obviously benefits gold, as it usually foreshadows much higher future inflation.) This is in good part due to the unsustainable budget deficits in most Western countries.

Moreover, the banking crisis is nowhere near fixed - in fact the United States has witnessed 92 bank failures so far this year, compared with only 25 for the whole of 2008.

The Federal Deposit Insurance Corporation's "problem list" of banks that are at risk of failing in the near future jumped to a 15-year high of 416 banks at the end of June from 305 in the first quarter.

European banks likewise do not appear in much better shape.

Locally, Hong Kong recalling its gold reserves from London and opening a new bullion depository at the Hong Kong International Airport should be seen as another bullish factor for gold.

Clearly, the precious metal's demand from both the mainland's central bank and Chinese private individuals is increasing and mainlanders have become the world's largest gold buyers.

But the strongest indications yet of gold/precious metals prices likely moving much higher are issues not that much talked about.

One is the fact that, while gold prices have more than tripled since 2001, production has actually fallen by approximately 5 percent during the same period.

This is interesting because under normal circumstances a strong increase in the price of any commodity would trigger production increases.

The fact that this has not happened implies that new gold supplies are very hard to come by.

Also Toronto-based Barrick Gold Corp has announced its plan to eliminate all gold hedges by raising up to US$4 billion in a share offering.

Since Barrick holds the largest hedge book of all gold miners, this means that it may even have to become a net buyer of gold in order to be able to eliminate its massive gold short positions.

It seems rather clear that a position in precious metals would most likely be beneficial to any investor's portfolio.

But one should be very careful as to how one gains exposure, because there is approximately 78 times more "paper- gold" being held by investors than physical gold in existence on this planet that has ever been mined, according to the World Gold Council.

As this clearly implies that un- backed "paper-gold" accounts may be subject to the risk of default, investors should stay clear of buying paper-metal accounts from banks and make sure that any precious metal investment vehicle used does actually store the metals in a fully unencumbered, "un-leased" and physical form.

Martin Hennecke

China could buy IMF gold

The Asian superpower is said to be considering the purchase but, only the price is right and the return is "relatively high"

Author: Reuters
Posted: Monday , 21 Sep 2009

BEIJING (Reuters) -

China is considering buying gold being offered for sale by the International Monetary Fund, Market News International said on Monday, citing two unnamed government sources, but the report could not immediately be confirmed.

"China will consider buying if the price is right and the return is relatively high," MNI quoted one of the government sources as saying.

Gold XAU=, which had dipped just below $1,000 an ounce, rebounded to $1,003.45 after the report. That would put the market value of the 403.3 tonnes on offer from the IMF at close to $13 billion.

"There was a small reaction to the news that China may discuss its gold plans at the G20, it recovered a little, but overall the market isn't overly concerned, not yet anyway," a Europe-based trader said.

China, the world's biggest producer and buyer of gold, revealed earlier this year that it had lifted its own stocks of gold to 1,054 tonnes from 400 tonnes when it last reported its holdings in 2003.

The IMF formally endorsed a plan on Friday to sell 403.3 tonnes of gold, one eighth of its holdings, to central banks or in the gold market.

Two Chinese central bank officials not directly involved in the issue told Reuters China should consider buying the gold being put up for sale by the IMF, but only at a big discount.

The officials, neither of whom had direct knowledge of the gold strategy, said they were expressing personal opinions.

"China only has about 1,000 tonnes of gold reserves and the investments in other assets are performing not very well," said one official, who declined to be named.

"I think we should build up more gold with foreign reserves, but when to buy is the key. It's a good idea if China can buy the gold from IMF at prices well below market level."

The official said he had no idea if the sale would be on the agenda for the G20 summit.

"I personally think China should buy the IMF gold. It will help China to diversify its reserve assets," the second official said. "For the purpose of reserve safety, it is also good to increase the proportion of gold by a suitable amount."

The estimated $13 billion cost of the gold is small beer for the Chinese exchequer, with foreign exchange reserves of more than $2 trillion. If it decided to buy the gold, China would be likely to seek a discount for the bulk purchase, since a market sale would put heavy pressure on the price.

The IMF has said it will try to sell the gold, one-eighth of its holdings, to central banks. If there are no takers, it could sell to the market, which saw world gold demand of 3,880 tonnes last year, according to World Gold Council figures.

The huge increase in reserves that China announced earlier this year had had little impact on the market because the gold was accumulated over a long period and mainly through direct purchases from Chinese producers. (Reporting by Eadie Chen and Tom Miles; Editing by Clarence Fernandez)

Gold's big picture bullish; good upside silver potential

After some gold ETF redemptions, ETF holdings have started to climb again, which ScotiaMocatta considers a "potentially bullish development."

Author: Dorothy Kosich
Posted: Monday , 21 Sep 2009


"The big picture remains bullish for gold," ScotiaMocatta advises, "and if equities start to correct more safe haven buying might return."

ScotiaMocatta also suggests, "Silver's rebound is looking robust and with prices continuing to outperform gold, there is likely to be good upside potential."

Meanwhile, gold ETF holdings are starting to rise again, suggesting redemptions have run their course, which ScotiaMocatta calls "a potentially bullish development."

In their September 2009 Metal Matters, ScotiaMocatta noted gold consolidated in August after June's sell-off and July's rebound. In the meantime, there were some redemptions in the gold ETFs, "not enough to damage sentiment too much," the gold bullion experts said.

"Although there seems to have been strong waves of bullish sentiment flowing through the markets as optimism for an economic recovery is running high," ScotiaMocatta advised, "there are numerous areas of uncertainty that could scupper this optimism. "

Nevertheless, ScotiaMocatta suggests, "the big picture remains bullish and although a downside correction in the wider markets might still drag gold prices lower as investors move into cash, the secondary reaction might be for investors to store their cash in bullion as the dollar and other currencies could well suffer if the markets enter another period of turbulence."

Meanwhile, ScotiaMocatta says, "Silver's rally looks robust." However, they noted, silver ETFs suffered a pull back with one of the ETFs enduring an 82-tonne drop in its holdings on August 27th.

"Silver has potential to rise on either an economic recovery, or if safe-haven demand rises in the face of further turmoil in the financial markets," they forecast.

"The big picture outlook for bullion remains bullish," ScotiaMocatta advises. The silver price "may suffer some selling if equities correct, but any price weakness in silver is likely to attract even more buying as investors rotate from equities back into safe-haven products, such as silver and gold."

In the meantime, palladium has outshone platinum setting fresh 12-month highs, ScotiaMocatta noted.

"Strike action in South Africa and the low levels of Palladium exports from Russia, are likely to dominate sentiment," they advise

International Monetary Fund to sell over 403 tons of gold

By Agence France-Presse
Published: September 19, 2009

The International Monetary Fund said its executive board endorsed the sale of 403 tons of gold, worth an estimated 13 billion dollars, to boost its lending capacity to poor countries.

The IMF said in a statement the sales would be “in a volume strictly limited to 403.3 metric tons, with these sales to be conducted under modalities that safeguard against disruption of the gold market.”

The 186-nation institution said the decision was a core element of a new income model to make it less dependent on its lending revenue to cover expenses, such as surveillance of members’ economic and financial policies, that the board had approved in April 2008.

The Group of 20 key developed and developing countries, at their April summit in London, agreed the gold sales should allow the IMF to offer favorable conditions on loans to the poorest countries.

The IMF decision comes ahead of a two-day G20 summit in Pittsburgh, Pennsylvania, that opens next Thursday.

Hosted by US President Barack Obama, leaders are to discuss efforts to recover from the worst global recession in six decades and financial regulatory reform.

“The new income model is designed to provide the fund with more diverse income sources that are better aligned with the variety of functions performed by the fund, with a central component being the funding of an endowment with the profits from these limited gold sales,” the 186-nation institution said.

The IMF said the sales “will also increase the fund’s resources for lending to low-income countries,” a strategy that won board backing in July.

“I am delighted that the executive board has given its overwhelming backing to a strictly limited sale of fund gold to put the financing of the IMF on a sound long-term footing, and enable us to step up much-needed concessional lending to the poorest countries,” IMF managing director Dominique Strauss-Kahn said in the statement.

“These sales will be conducted in a responsible and transparent manner that avoids disruption of the gold market,” he said.

The amount of gold to be sold is one-eighth of the 3,217 tons of gold currently held by the Washington-based IMF, the third-largest official holder of gold after the United States and Germany.

Board approval required an 85 percent majority of the total IMF voting power.

The United States, by far the largest stakeholder, gave its green light after Congress passed legislation authorizing the sale and President Barack Obama signed it into law on June 24.

The fund is required by its founding document to conduct all gold sales at market prices.

The IMF did not state the value of the gold to be sold but based on the current bullish near-record market price for the metal, it is estimated the sale would fetch 13 billion dollars.

Under the approved plan, the IMF would offer to sell gold directly to central banks “or other official sector holders if there were to be interest from such holders.”

A prime candidate could be China, which is sitting on the world’s largest foreign exchange reserves, topping two trillion dollars, and has been seeking to diversify away from the dollar.

China in early September agreed to buy the first IMF bonds for about 50 billion dollars and has been on a gold-buying streak, increasing its gold reserves by 75 percent from 2003 to 2008, according to official media.

The IMF said that if official demand is insufficient, it could conduct the gold sales “on-market in a phased manner over time,” in line with an approach already followed by central banks.

The IMF would be constrained by the overall ceilings agreed by the central banks, which currently is 400 tons annually for the next five years, starting on September 27.

The IMF said it “will inform markets before any on-market sales commence” and “report regularly to the public on the progress with the gold sales.”

In July, the IMF announced it would increase its lending to poor countries, mostly in Africa, to 17 billion dollars by 2014, including 8.0 billion over the next two years.

That compares with an annual average of one billion dollars in the 2006-2008 period to poor countries, and three billion dollars in the first half of 2009.

The IMF also had decided to cancel interest payments owed by poor countries through end-2011 and reform lending practices to make loans quickly available, at higher ceilings on amounts and with more flexible conditions.


Gold is due a correction – but then it will hit $1,400

By Dominic Frisby Sep 16, 2009

Gold closed last week above $1,000 an ounce, its highest ever weekly close. Yet who was reporting this fact in the Sunday papers?

I was reading The Telegraph, whose financial coverage is generally ahead of the curve compared to the other broadsheets. I was delighted to see that, far from being on the front pages, gold's milestone got barely a passing mention.

The fact is, the mainstream still don't get gold. The longer this continues (and long may it) the longer this bull market has to run.

However, in the short term, a few indicators are telling us to be wary. Gold has a nasty habit of frustrating the impatient – and it may just be about to do so again...

There's a lot of activity in the gold market right now

Every Friday, details of the commitments of traders on the Chicago futures exchange from the previous Tuesday are published. This enables all and sundry to see how the large funds and professional traders are positioned in the gold market. Each futures contract is worth 100 ounces of gold – roughly $100,000. For every buyer you need a seller (or to put it another way, for every long you need a short).

Open interest (the total number of contracts open on gold, both short and long) currently stands at 451,000 contracts, or $45.1bn. That's a lot of money – an unprecedented amount in fact, as we'll discuss in a moment. Basically, it shows that there's a lot of activity in the gold market right now.

You have to ask yourself, how much of that $45bn is actual money, and how much is leverage (debt). You also have to wonder, if new money is going to come into this market and push it higher (so that the open interest increases), where is that new money going to come from? One answer might be the central bank printing presses.

As well as being a lot of money, it's a lot of gold: 45.1 million ounces, or just over 1,400 tonnes. That's more than the official gold holdings of Japan, Russia, Switzerland, India, Spain and the UK (we have just 310 tonnes), according to numbers reported to the International Monetary Fund. If open Comex interest were a country, it would be one of the world's top ten holders of gold.

Looking at this figure another way, roughly 2,400 tonnes of gold were mined last year across the globe. So the current open interest on the Chicago futures exchange amounts to more than half of annual global production. If all those who have bought a contract held out for delivery of their metal – which they won't – those who had sold could have quite a problem finding the metal to deliver (bearing in mind that not all newly mined gold finds its way onto Comex).

Be warned: gold is due a correction

Despite the lack of reporting in the press, this open interest is unprecedented. It's never been so big. On the one hand that's something to get excited about, but on the other it is flashing a warning light. Often in the past when interest has neared these levels, it has presaged a major correction and the end of a run. So be warned.

The good news is that there have been occasions when such interest has only resulted in minor corrections. One example is in October 2005, when gold was trading at around $470 an ounce. We got a slight correction, then gold launched itself beyond $700 by May 2006. The same happened in late 2008, when gold was $850. There was a correction of about $50, then gold moved over $1,000 by the following March.

Given that even during gold's major advances we often see a correction in October, and given that gold's summer low appears to have come early this year, at the start of July, it's not unreasonable to expect some kind of seasonal pullback over the coming weeks. That could easily knock us back to $960, or even below $900.

But for now we have a nice intermediate-term trend developing in gold, as the chart below shows, and we are making higher highs and higher lows with each step forward.


Is gold's next big upmove underway?

I have mentioned before gold's habit of consolidating for 18 months or so, then making a big move of six to nine months, where it moves up some 40-50%, before another period of consolidation. It is my belief that, even with a possible imminent correction, gold's next big upmove is now underway and by next spring we'll be somewhere near the $1,400 mark.

Much of this move in gold is a symptom of the falling dollar, but gold is also in a nice uptrend when measured in pounds, as you can see by the next chart.


I would like to see this all confirmed with a couple of weekly closes above the old high of $1,033. Until we do, there is the risk of a double top. The only person who would want that is Gordon Brown – and anyone who is short on the Comex.

Four major developments all gold investors should watch

Jason Hamlin, GoldStockBull.com Published 9/14/2009

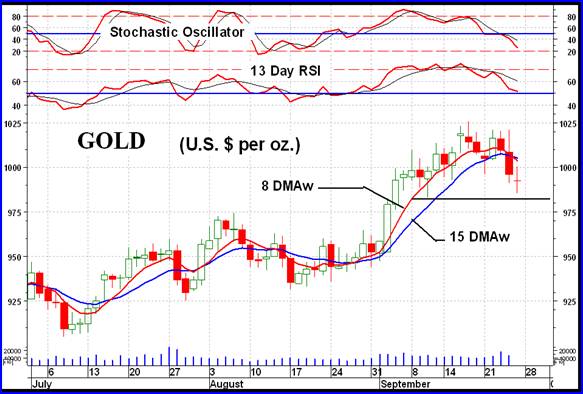
Gold has finally breached the $1,000 level and looks like it might hold the line on this latest attempt. I anticipate that this psychologically-important level will turn from resistance into support as gold makes new highs towards the end of 2009. If I am correct, right now is the last chance investors will have to purchase gold for under $1,000/ounce.

A series of new and significant events have unfolded over the past few weeks that have influenced the precious metals markets and will likely continue to support gold’s price advance. If you are a gold investor, it is important that you understand these events and the impact they are likely to have on your investments.

Development #1 – China Encouraging Citizens to Buy Gold and Repatriating Gold Holdings from London

China is making a series of calculated decisions in order to mitigate the risk of a dollar collapse. They have already come out strongly and repeatedly in favor of a new reserve currency to compete with the dollar and have quietly been making large purchases to increase their gold reserves. But the Chinese government has taken it a step further this year. Financial Sense reports:

As recently as 2002, the private ownership of gold was prohibited in China. You could be jailed if caught with any in your possession. Beginning in 2009, in a stunning about-face, the central government removed all restrictions. In fact, as Mineweb and other sources report now it’s actively pushing folks to buy some personal metal, with China’s Central Television, the main state-owned television company, running news programs cum infomercials, letting the public know just how easy it is to purchase gold and silver as an investment.

It truly is as simple as can be, because every bank sells gold and silver bullion bars in four different sizes to individuals. (Try to find the same the next time you make the trek down to Wells Fargo.) Mining companies are reportedly encouraging employees to convert some of their wages to gold on payday. Gold is traded in some form 24 hours a day. And paper proxies for the metal are also soaring in popularity. There are persistent rumors that the export of silver has already been banned. Gold could be next.

Thus China, which only yesterday was the lowest per-capita consumer of gold in the world, is bidding to become the biggest. Some analysts believe it will pass India – the top dog since forever – as early as 2010. Clearly, the government believes the country is strengthened if everyone who can holds some hard currency.

All this suggests a mania in the making, and only in the formative stage. Imagine if hundreds of millions of new consumers climb on that particular bandwagon…

Indeed, if China’s newly formed middle class begins using even a small portion of their disposable incomes to purchase precious metals, a whole new source of demand will exert its influence on the gold markets.

In another brazen move, Hong Kong is pulling all its physical gold holdings from depositories in London, transferring them to a high-security depository newly built at the city’s airport. I believe that China demanding physical delivery of their gold will force the unwinding of derivatives and leases on the gold, tactics that many believe have been employed by Western governments in order to suppress the gold price. Some will go as far as to suggest that the physical gold may no longer be on hand in London. From my viewpoint, this transfer and demand for physical delivery can only be bullish for the gold price and beneficial to precious metals investors. As Jim Sinclair’s MineSet newsletter continually reminds investors:

“Nothing will unnerve the paper gold shorts more quickly and do more to undercut their confidence than to strip them of the real metal and force them to come up with more hard gold bullion to make good on deliveries. “Stand and Deliver or Go Home” should be the rallying cry of the gold longs to the paper gold shorts.” –Trader Dan Norcini


Development # 2 -The World’s Largest Gold Producer, Barrick Gold Corp, Announced a Decision to Close Its Massive Hedge Book

The world’s largest gold producer, Barrick Gold (NYSE: ABX), announced last Tuesday, Sept. 8, that it intends to pay off its entire book of fixed-price gold hedges and a portion of its floating hedges to gain greater exposure to the market price of gold. Barrick’s decision to close its 9.5 million ounce hedge book just as gold has taken out the $1,000 level speaks volumes. Instead of waiting for a correction and lower pricing, they are eager to gain full exposure to the gold price. What might the largest gold producer know about what is in store for the gold price and why the rush to de-hedge as gold is breaking $1,000? Forbes posed the same question:

It’s also another very strong signal from sophisticated operators who know the gold market best–gold mining company executives with the most on the line when they move from the certainty of having future production sold at locked-in rates to an environment in which their fortunes are fully leveraged to the price of gold.

In terms of scale and effect, Barrick’s move to de-hedge, the fixed price contracts alone (3 million ounces) are equivalent to reducing total annual global gold production for all gold producers by about 4 percent. The additional floating price hedges (6.5 million ounces) represent an additional 7% of annual global gold production for a grand total of 11% of annual global production. This is very bullish for gold going forward and a key reason the price closed last week above $1,000 an ounce, the highest end-of-week close ever.

Development # 3 – COMEX Commercial Traders Have Taken the Largest Net Short Position Against Gold & Silver Ever on Record

It is not unusual to see commercial traders go heavily short when gold makes a big run, but they have effectively gone “all in” this time with their total net short position setting a new record. These are presumably the most well-informed traders or “smart money.” While this news is usually very bearish and a preclude to a massive sell off, it is interesting to note that the commercial net short position increase was actually less than the increase in total open interest. In other words, despite taking record short positions against gold, they were unable to absorb all of the buying pressure. This is further evidenced by the fact that gold has held onto recent gains and continues hovering around the $1,000 mark.

I would not go so far as to say that gold investors are out of the woods quite yet. It will be interesting to see how the positions of commercial traders have changed over the past week. You can track the COT at this website: http://www.cftc.gov/marketreports/commitmentsoftraders/index.htm

My takeaway from this report, despite the record short position, is that the news is bullish for gold and could be the prelude to a huge move to the upside. If commercial shorts went so far as to establish a record net short position and still did not meet the increase in open interest, this suggests there is some very intense buying pressure on the other end. It may also suggest that many of the current gold buyers are demanding delivery of the physical metal and are no longer willing to accept a paper promise for future delivery. Which leads us into our fourth and final major development for precious metals…

Development # 4 – Gold and Silver Slipped into Backwardation Last Week

Both gold and silver slipped into backwardation last week. It was a light backwardation, but it is a relatively rare occurrence for precious metals and warrants our attention.

The term backwardation pops up every so often in the precious metals investment community and there is often confusion and misinformation around the topic. Backwardation exists when the price of a commodity for immediate delivery is higher than its price for delivery in the future. It can be interpreted to mean that people controlling the supply of monetary gold cannot be persuaded to part with it, regardless of the bait and suggests that there is more demand for immediate physical delivery than there is metal to service it.

Backwardation is usually viewed as a bullish sign for the underlying commodity. But to be fair, commodities go into backwardation for a variety of reasons and backwardation can last for quite some time and never lead to a breakdown of the delivery mechanism.

Still, with the news from China and signals that Russia and other countries are scrambling to increase their gold reserves, the current backwardation could be a very real sign of increased demand for physical delivery. This could blow the lid off what seems to be a long-standing attempt by issuers of fiat currency to suppress the price of gold and maintain their power structure. If more and more buyers begin demanding physical delivery, we could see the paper manipulation schemes unravel and a potential default of the COMEX. This could be the impetus for an explosion in prices for both gold and silver. I am not prophesying if and when this even will unfold, but simply calling attention to the possibility. For now, we will keep a closer watch on the degree of backwardation and continue to report as events unfold.

Any way that you look at it, we are entering intense times in the financial markets and a reality check for the monetary system that has brought great advantage to the United States since establishing the dollar as the world’s reserve currency. With the U.S. government creating an unfathomable amount of debt in a very condensed time period and China growing increasingly impatient, I believe it is only a matter of time before we experience a severe inflationary period. Those in power might be able to manufacture one last rally for the dollar and correction for gold, but each attempt seems to be dwindling it both its potency and stamina. The “banksters” are literally running out of arrows in their quiver. Reducing your exposure to the dollar and protecting your assets with a sensible allocation of gold and silver seems like an obvious move at this juncture.